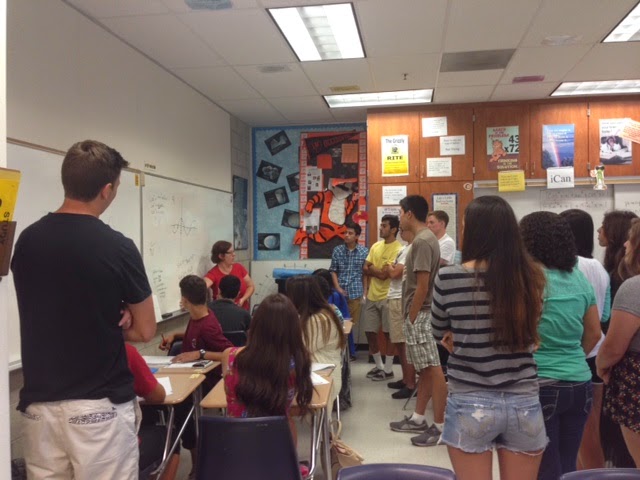
Today was a great day. The Calculus students were busy working on a review that I gave them for the end of the Preview chapter (a review chapter of all the math they learned in the past 3-4 years. There were A LOT of cobwebs needing to be cleaned out in their brains. Things like where are the principal values for sin, cos and tan located?; how do we solve a trigonometric equation?; and what does arcsin mean? I nicknamed someone Captain Jack Sparrow because he had found the buried treasure (after solving a problem) and then I made his group the class experts for explaining it to others when they got stuck. In one class period we had a "gather round" to see the work of 3 separate groups on a tricky problem and I explained how mathematicians
try something with new problems, not just stare at it and complain
this is too hard, or
I don't know how to do this! I stated that there were going to be lots of problems they wouldn't know how to do this year, but that these "giving up" approaches were not progress toward learning. I explained that the groups I had nudged had come up with those processes on their own, I had simply asked a few questions. SUCCESS!!
One of the district tech coaches came out to meet with me today (thereby definition of a good day...I always love that I get to learn new things in tech). I got lots of tricks, tools and good info to keep me busy for a few weeks. But the best part is that I actually got to share something with him that he didn't know. SUCCESS for me! I am enjoying my moments where I get to give back to others and share something!


Now on to the AP Stats class. At the beginning of the year we are looking at all the different ways we can graph data. At first students think "this is gonna be easy" and then the questions come with all the different types of graphs: frequency graphs, cumulative frequency, relative frequency and cumulative relative frequency graphs are the "killers". And then the questions switch up which version of graph is the most useful for reading...or even worse, there is no choice. The graph is given to you and the questions require thinking....DEEP thinking. Sometimes backward thinking. "Dope, I think I just felt an aneurism!" This is where the students start to come "unglued". This is a new experience! And they start to think "I don't know what I'm doing and I'm not going to be successful in this class". That was plank we were walking out on today. I can feel it and I expect it. So, tomorrow is "the talk". Their stress level is getting a little high and I have to calm them back down, give them a pep talk and let them know "it's gonna be okay". It's always funny at the end of the year when they write their suggestions to me for next year and many say "go faster in the beginning". They forget that "the beginning" was a struggle too. But as we progress, so much of what they learn becomes part of their "fabric" as though it has always been a part of them and they can't remember not knowing it, or struggling with it. Happens EVERY year!
No comments:
Post a Comment